


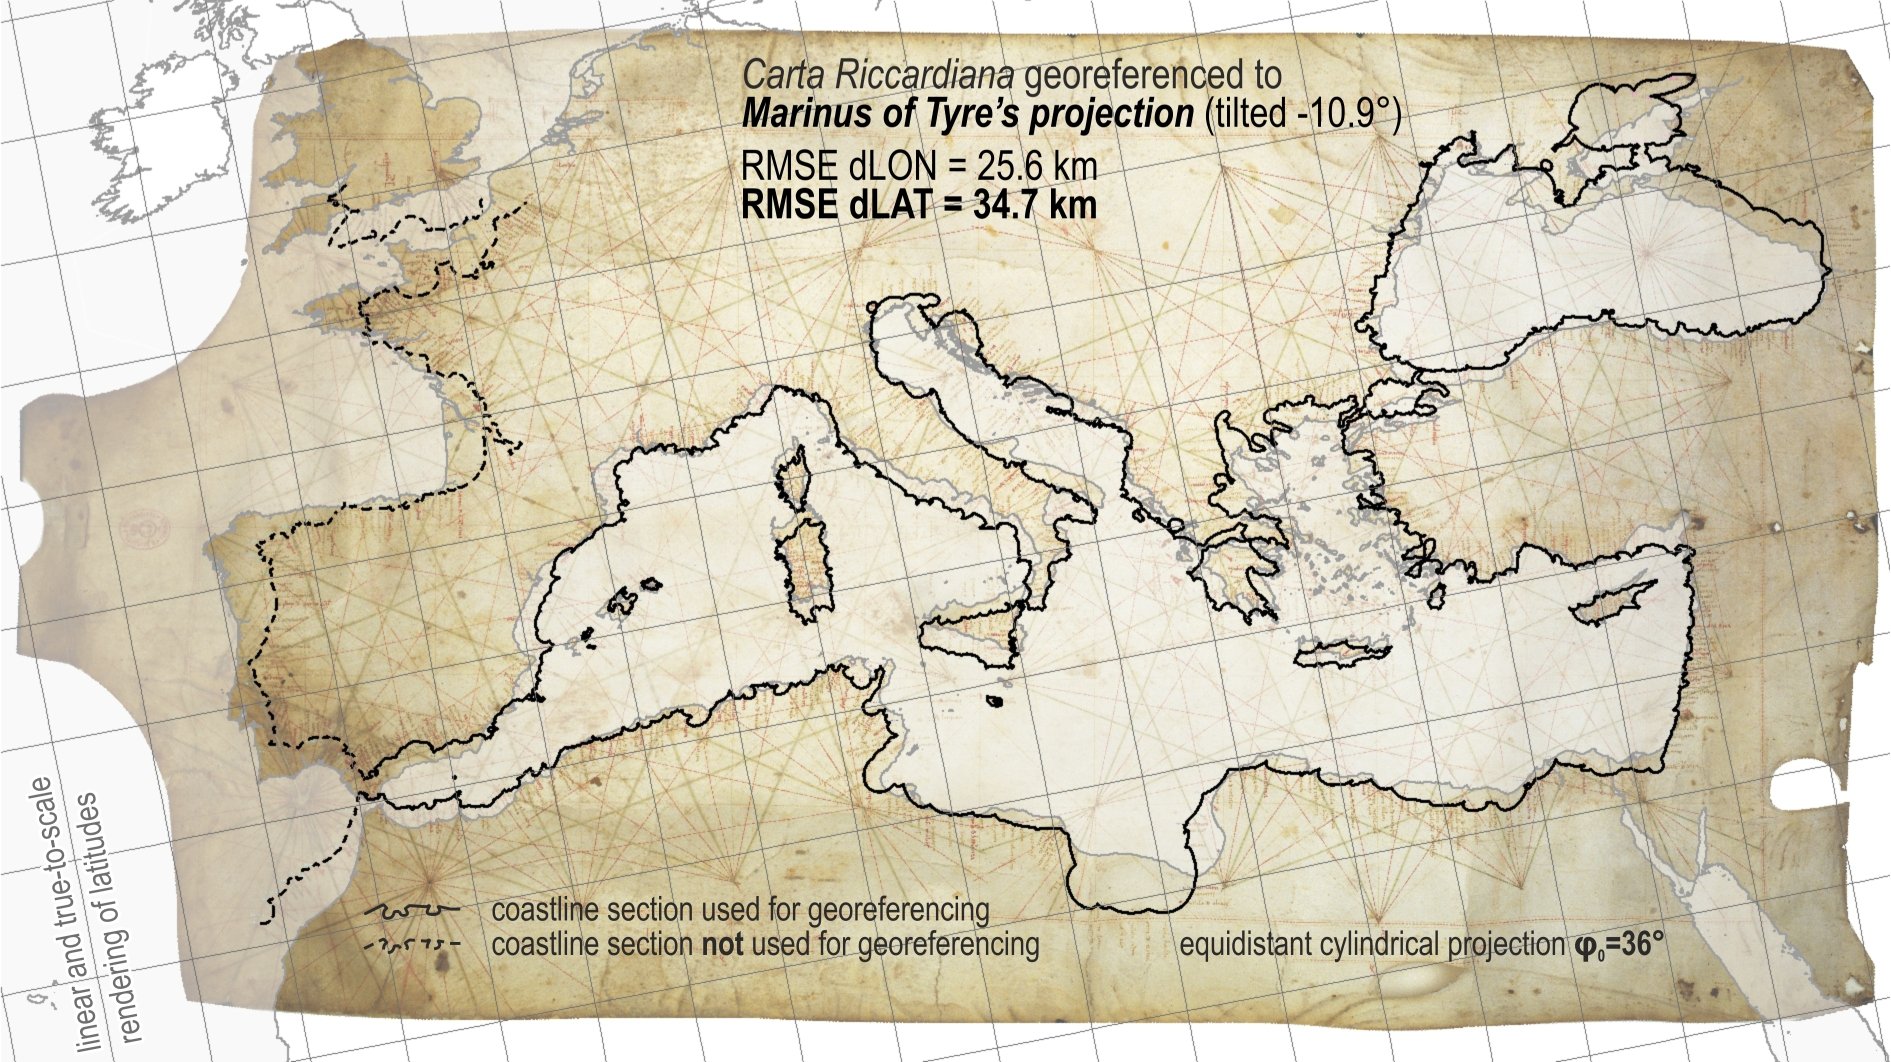
“We’ll just have to think our way back, step by step.” That’s what the Dutch geodesist Roelof Nicolai said in 2014 in a Strange Maps article. Nicolai had just spent his PhD years discovering that portolan charts — those gorgeous, wind-rose-covered coastline maps that suddenly appeared in Mediterranean ports in the second half of the 13th century — were geometrically too accurate to have been made the way everyone assumed. Something else was going on.
Twelve years on, we might have an answer. Tome Marelić, an assistant professor of geography at the University of Zadar in Croatia (and the current vice chair of the Working Group on the History of Cartography within the International Cartographic Association), has spent years doing exactly the step-by-step thinking Nicolai prescribed in 2014. Read together, his scientific articles amount to the most detailed forensic examination portolan charts have ever received. And the story they tell is more satisfying than even the more out-there theories (including “aliens did it”).
First, a quick refresher. A portolan chart is a nautical chart of the Mediterranean, western European, and northwest African coasts, criss-crossed with dense color-coded web-like networks often called “rhumb lines,” dotted with harbor names written perpendicular to the coast (so you had to keep spinning the chart to read it). The charts are calibrated with little beaded…
Source: Big Think — Read the full article on the original site ↗