


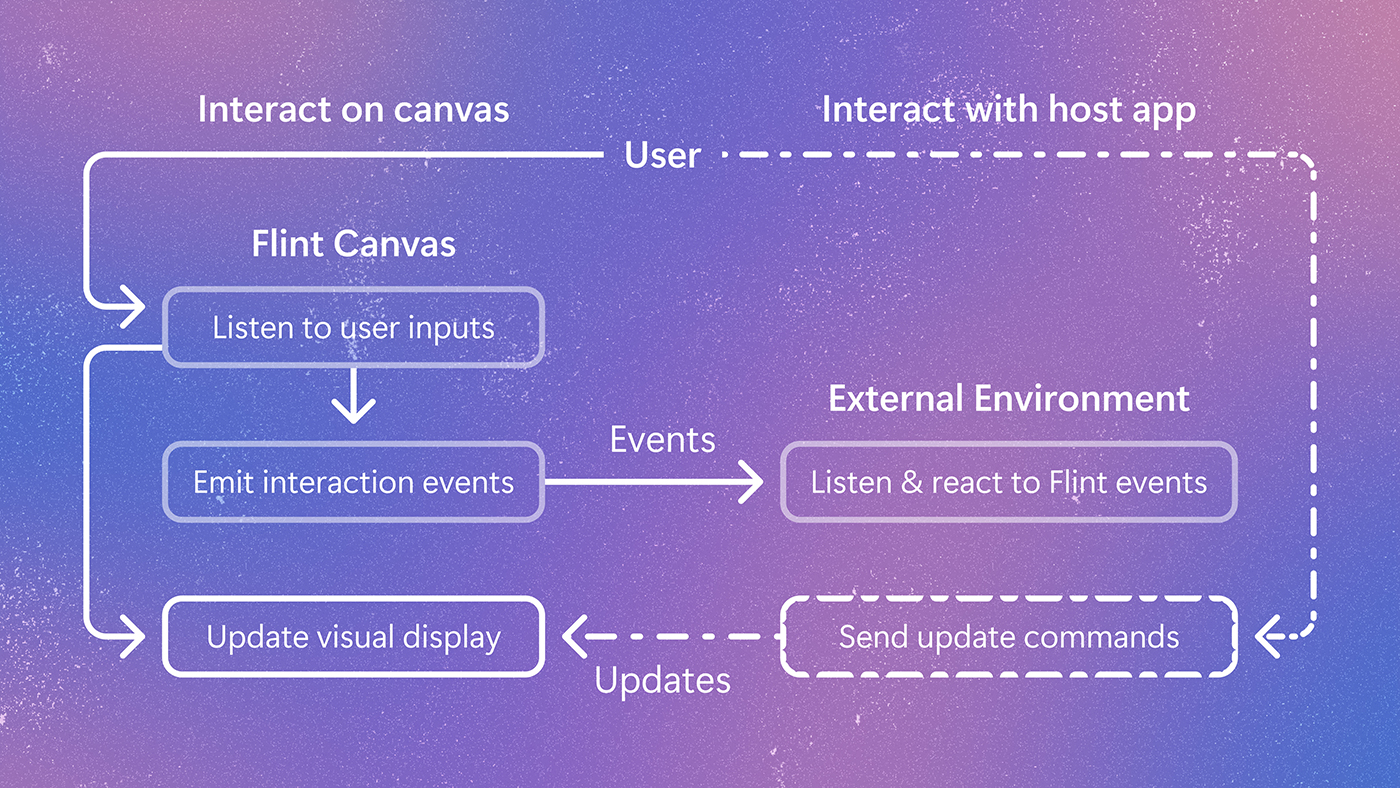
AI agents make it easy to analyze data and generate reports with data visualizations. They help users examine patterns more efficiently than by reading verbose text. However, when we’re feeling exploratory, we want to go beyond static visualizations.: We want to interact with charts to zoom in on details, compare data across charts, or even highlight related text in the document from a chart selection, and vice versa. This requires agents to be able to create interactive data visualizations that communicate information while letting readers explore beyond the author’s chosen view, ideally with the quality of interactive stories in sophisticated data journalism. This leaves us wondering:
Yes, it’s possible, but there is a significant practical gap. Even with capable frontier models, we still face:
These challenges help explain why consistently generating high-quality interactive visualizations remain difficult in real-world use. Meanwhile, built-in interactions in some visualization libraries are not expressive enough on their own to create bespoke interactive charts. And these challenges are results of the lack of an expressive yet high-level language to specify visual interactions.
Join Microsoft’s Peter Lee on a journey to discover how AI is impacting healthcare and what it means for the future of medicine.
Source: Microsoft Research — Read the full article on the original site ↗